Impact Estimation Tables, Tom Gilb’s tool for weighing design ideas against quantified objectives, have an entirely different heritage from the X-Matrix. Gilb’s table sits at the heart of his Planguage approach, described in his 1999 paper Understanding Complex Technology Quantitatively. The two do share an inclination that I think is worth exploring.
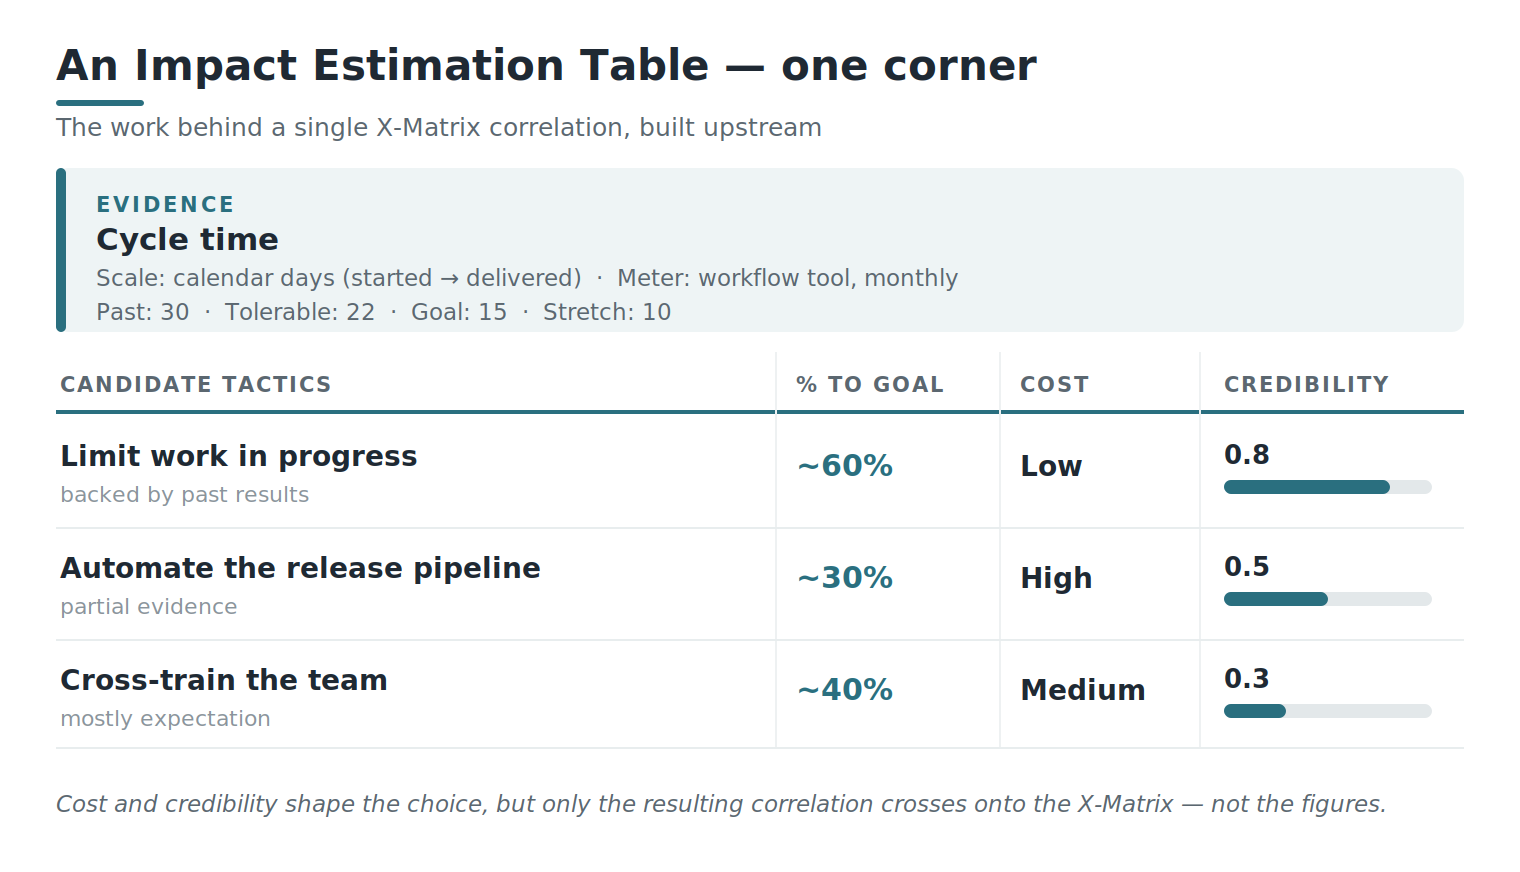
Across the top of the table go objectives, each defined with a Scale (the unit of measure) and a Meter (how it will be measured), anchored by a Past benchmark. Gilb specifies a range of desired levels rather than a single number: a Tolerable level you must not fall below, the Goal you commit to, and a Stretch beyond it. Down the side go the design ideas, which are the means of moving towards those objectives. Each cell then holds an estimate of how far a given design carries you from Past to Goal, expressed as a percentage, along with an uncertainty range, the evidence behind it, the source of that evidence, and a credibility rating. The image above shows a simple example.
Structural similarities
Seen as a grid, Impact Estimation Tables share structural similarities with the X-Matrix. Both connect ends to means and make contributions visible at the intersections, rather than burying them in a list. The X-Matrix does this using the matrices in its corners, which correlate Aspirations, Strategies, Tactics, and Evidence with one another. The visual resemblance is clear. What makes the comparison interesting, though, is both where they agree and where they part.
A note before going on: Impact Estimation Tables are part of a discipline in their own right, and I am engaging only one aspect of them here. A full table does far more than I describe, by costing design ideas, weighing cost-to-benefit ratios, understanding critical stakeholder needs, and more, standing as a complete decision tool. This is not intended to be a detailed tutorial. Instead, what follows uses a simple form, sufficient to show the synergies and how the two can work together.
A shared order of evidence
The first thing the two tools agree on is sequence. With Impact Estimation Tables, you cannot estimate a design’s impact until the objective has been quantified. No Scale and Meter means that there is no cell to fill in. You cannot assess a means against an end you have not yet defined.
That is the same direction of flow I have previously written about. Define direction first, and only then decide how to make progress. The X-Matrix takes the same approach, working through True North, Aspirations, Strategies, and Evidence before turning to the Tactics and correlations that link them together.
Where they part company
Then comes the parting of ways. Gilb’s view is to quantify everything. An objective without a specific number is, for him, barely an objective at all.
The X-Matrix does not avoid measurement. Its Aspirations and Evidence can carry numbers, and often do. Quantification, both subjective and objective, is useful in attaining clarity on an objective. However, the matrices reflect correlations and not causation, and those correlations are deliberately qualitative; strong or weak, direct or indirect. That is because the contribution of one element to another is rarely exclusive or a neat decomposition. The Aspirations, too, are framed as ambition rather than prediction, which is why I have written before about how I avoid the word target.
Thus, the perspective the X-Matrix takes is not against quantification, but it doesn’t attempt to quantify each individual contribution.
Whether the plan adds up
Keeping the correlations qualitative has a price. Because every impact in an Impact Estimation Table is a number on a shared scale, the columns can be summed to ask whether the design ideas, taken together, carry far enough to reach the Goal, with a safety margin to spare. The X-Matrix, holding only qualitative correlations, cannot. That sufficiency check is one of the most powerful things that Impact Estimation Tables offer, and it is not part of the X-Matrix.
Nor could it be, because the X-Matrix is not deterministic. The correlations are hypotheses about contribution, not measured quantities, and adding up a column of them would manufacture a confident total out of shades of judgement. Declining to sum is not a weakness, but an acceptance of the inherent ambiguity and uncertainty.
What the X-Matrix offers instead is messy coherence. Rather than totalling a column, you read the pattern across the whole matrix: an Aspiration with only weak or indirect correlations feeding into it is the signal that the plan may not be enough. It prompts the same question Gilb’s sum prompts, which is “do we have enough here?” However, it is answered through a conversation rather than a calculation.
The judgement behind the correlation
Feeding Impact Estimation Tables into the X-Matrix looks, at first glance, like a category error. Transfer an Impact Estimation Table’s quantitative percentages into the X-Matrix’s qualitative cells, and you risk importing the very false precision the X-Matrix was designed to avoid.
The resolution, I think, is to let Impact Estimation Tables inform the judgement behind each correlation, rather than supply the correlation itself.
A correlation in the X-Matrix is a judgement: this Tactic contributes strongly to that Evidence; another only weakly. What Impact Estimation Tables offer is a disciplined way of forming that judgement. Their estimate, evidence, cost, and credibility rating are the homework behind a correlation. They tell you how strong a contribution looks, how well-founded that is, and whether it runs directly or through some other factor. The table does not replace the correlation. Instead, it gives the correlation a reason for its strong or weak shade.
Read against the whole
There is also an argument that because the impact and credibility are numbers, drawing a correlation from them is just rounding that number to a shade. But the correlation is not the table’s output, rounded up or down. An Impact Estimation Table scores each design against one objective in isolation. The X-Matrix weighs each correlation in the context of all the others, because a contribution is rarely exclusive. So, the table informs the judgement, but it does not compute it. What crosses over is the confidence and its grounds, not the decimal places.
Thus, Impact Estimation Tables remain a distinct practice, with their own integrity, done off to the side. The X-Matrix is a qualitative summary. You keep the messy coherence and gain an evidential backbone behind the shading.
Sharpening the objectives
There is another, more subtle contribution, too. The discipline of defining a Scale and a Meter is a good way to sharpen the wording of an Aspiration or a piece of Evidence. It helps make it the kind of thing you could actually observe, without committing it to becoming a target. Thus, you borrow the rigour of measurement without the temptation to predict. How far you lean on this depends on the context: the more complex the situation, the lighter the touch, as I explored in the experiment trap.
Two examples in practice
The first example is making a choice. Suppose two or three candidate Tactics, all under the same Strategy, promise to move the same piece of Evidence, and you can only commit to one. Here, an Impact Estimation Table does the job it was designed for. It sets the options side by side against that Evidence and weighs each one’s likely impact against its cost, discounted by how credible its basis is, to help you decide which to back. The decision then lands on the X-Matrix as the correlations that follow. The chosen Tactic has a strong correlation. The alternatives drop away or have weak correlations.
The second example is testing a choice already made. Imagine populating an X-Matrix and reaching the correlations between Tactics and Evidence. One Tactic seems obviously strong against a piece of Evidence like cycle time; another, the room is unsure about. Rather than settling it by the loudest voice, you build a focused Impact Estimation Table for that corner, like the one in the image above. It is small in scope, but no less disciplined for it. You define the Evidence’s Scale and Meter, list the Tactics as the means, and ask what each contribution rests on, and how credible that is. The strong Tactic turns out to be backed by past results, with a confident, direct correlation. The disputed one rests on little more than hope, with a genuinely weak or indirect correlation.
Where cost fits
Notice that cost has a place in that first example but not on the matrix itself. That is deliberate. Cost belongs with the Tactics, which are the investments. It is not with the Strategies, which only guide where to look. A Tactic that earns its place carries an implicit hypothesis that it is worth its cost. And like any hypothesis on the X-Matrix, there should be a feedback loop to test it. Is it delivering the impact we hoped for at a reasonable cost? If not, it can be revised.
The division of labour
Both of the above examples come back to credibility. In the first, you are making a new credible choice. In the second, exploring the credibility of one that has already been made. And in both, the table never goes on the A3. It simply does its work upstream, so that the correlations that do go on are ones you can defend.
Why keep the X-Matrix at all, when Impact Estimation Tables could be considered the richer artefact? Because the two are not the same kind of thing. An Impact Estimation Table compares one objective against its candidate means in depth. The X-Matrix aligns, holding True North, Aspirations, Strategies, Tactics, and Evidence together on a single page, with all their many-to-many correlations, as something a group can co-create, argue over, and navigate by. That whole-picture coherence is not a lossy copy of a table. It is something the table cannot be.
That, for me, is the synergy: Impact Estimation Tables sharpen the parts, and the X-Matrix holds the whole.