I have recently been exploring in more detail how the X-Matrix might be used for an Agile Transformation. So far I have covered Aspirations, Strategies and Tactics. Following on from those, I will discuss Evidence in this post.
In some ways, this is probably the least controversial and builds on the work of two people who have influenced me greatly.
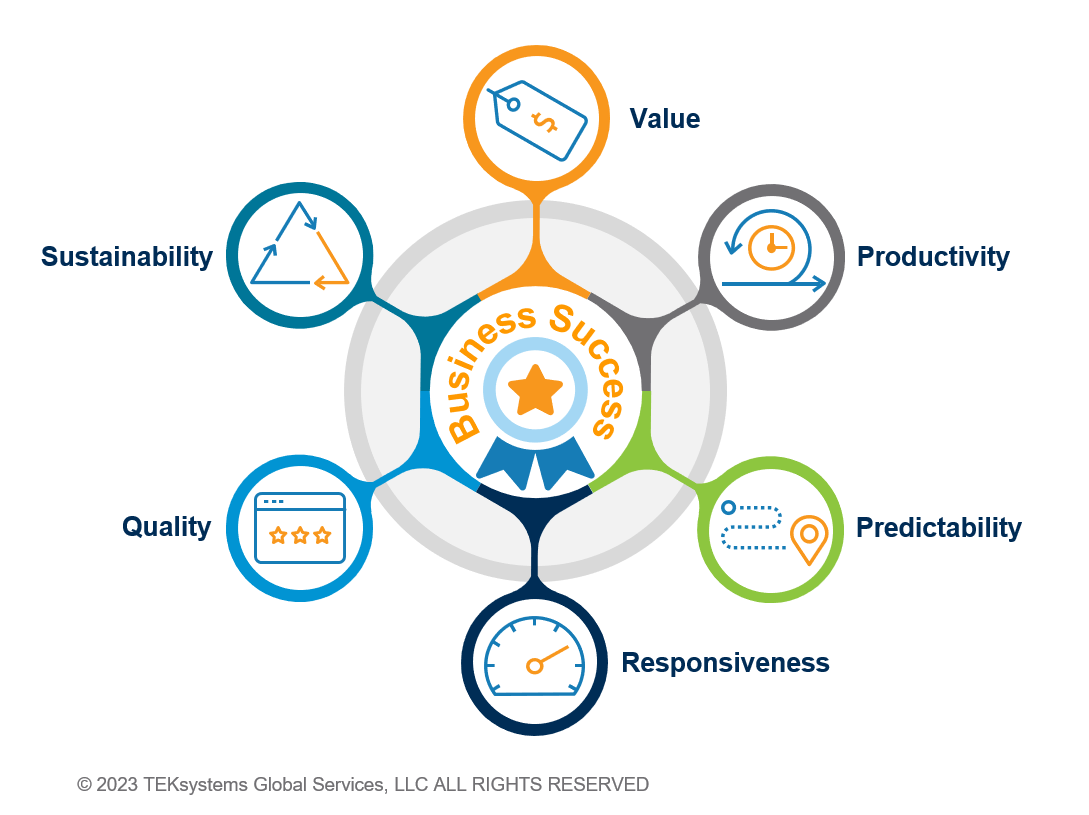
First is Larry Maccherone. I worked with Larry at Rally where he first published his research into The Impact of Agile Quantified. The second is Troy Magennis. Troy has built on Larry’s work and has written about the Six Dimensions of Team Performance. Consequently, it is these six dimensions that I use as the basis for describing evidence, albeit with some small tweaks in language. They describe important outcomes to look for as part of an Agile Transformation. The image to the right, which is one we use at TEKsystems Global Services, shows these dimensions.
Productivity
Evidence of productivity shows that work can be delivered in greater quantity. Throughput – the number of pieces of work per unit of time – is a good measure of productivity. For example, stories per week. Similarly, velocity can also be a proxy, although it can be too easily gamed. Additionally, the DORA metrics of deployment frequency can also correlate to productivity.
Predictability
Evidence of predictability shows that work can be delivered consistently and reliably. I talk about this in more detail in my post on how to measure the predictability of Agile. In that post, I recommend several measures. They include variability of cycle time, the amount of ageing work in progress or the number of blockers that are causing work to age.
Responsiveness
Evidence of responsiveness shows that work can be delivered quickly. Some form of cycle time is the most common way to measure responsiveness. That could be the full value stream cycle time. Or it could be a more qualified cycle time for a subset of the value stream. The DORA metric of lead time for changes is an example of this.
Quality
Evidence of quality shows that work is being delivered in the right way. The number of escaped defects that are reported after release is one simple way to measure quality. Additionally, some of the other DORA metrics are relevant here as well. Specifically, these are the mean time to restore and change failure rate. Finally, customer satisfaction can also correlate to quality, although this can also show evidence of value.
Sustainability
Evidence of sustainability shows that work can continue to be delivered in the long term. Two aspects of sustainability are important. Firstly, there is technical sustainability in terms of the state of the codebase and architecture. Code analysis tools which measure things like complexity, duplication or unit test coverage can be useful for this. A strong codebase and architecture will be more resilient to future changes. Secondly, there is human sustainability in terms of people’s ability to maintain their levels of performance. Employee or team engagement, or employee churn rates, can be useful measures for this. An unstable team with low morale runs the risk of losing valuable information and knowledge which will slow them down.
Value
Evidence of value shows that the right work is being delivered. Value as an aspiration overlaps somewhat with its use as evidence. Especially when it can often be very contextual and subjective for each organisation. However, strategic alignment can be a good indicator that the right work is being done. That is the percentage of the teams’ work that can be traced back to strategies, both intentionally and explicitly. Additionally, as noted earlier, customer satisfaction can also correlate to value.
It’s worth emphasising a few things for all these forms of evidence. Most importantly, none of these indicators are intended to be used as targets or incentives. As such, there needs to be a balance between them so that no single metric gets too much individual focus. Therefore, it is important to consider the impact of focusing too much on a metric, as well as focusing too little. There will have to be tradeoffs and they can’t all be perfect!
I haven’t given an exhaustive list here, and I’m always interested in learning about alternative indicators. So, if you have your favourites that I haven’t mentioned, please let me know!
[…] The Evidence To Look For In A Successful Agile Transformation (Karl Scotland) […]