How Medical SOAP Notes Endorse the Order of the X-Matrix
How a 60-year-old medical note-taking format – SOAP Notes – independently confirms why evidence should come before tactics in Strategy Deployment.
Karl Scotland – Using Agility Strategically
Karl Scotland – Using Agility Strategically
Karl Scotland – Using Agility Strategically
Browsing Tag

How a 60-year-old medical note-taking format – SOAP Notes – independently confirms why evidence should come before tactics in Strategy Deployment.
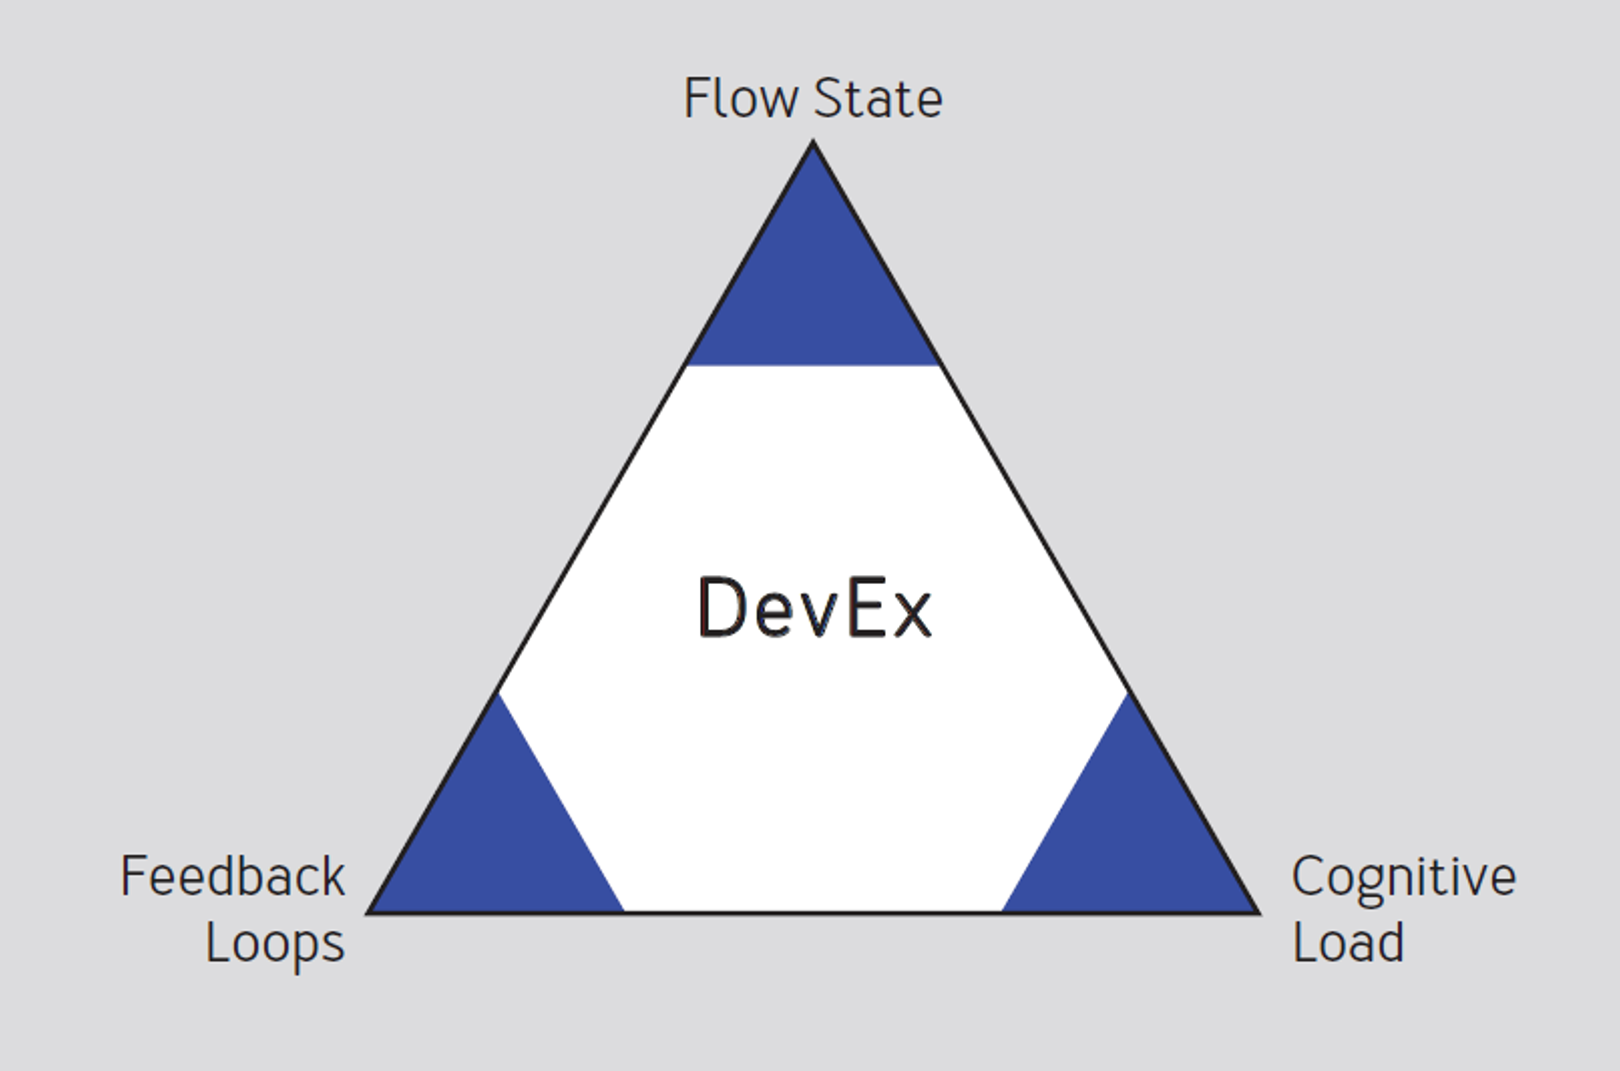
Developer Experience is the perception of developers’ work, with three dimensions. The dimensions can be a useful lens for Strategy Deployment with Agile.

A response to the McKinsey article on software developer productivity in which I shift the focus to development productivity as a balanced team outcome.
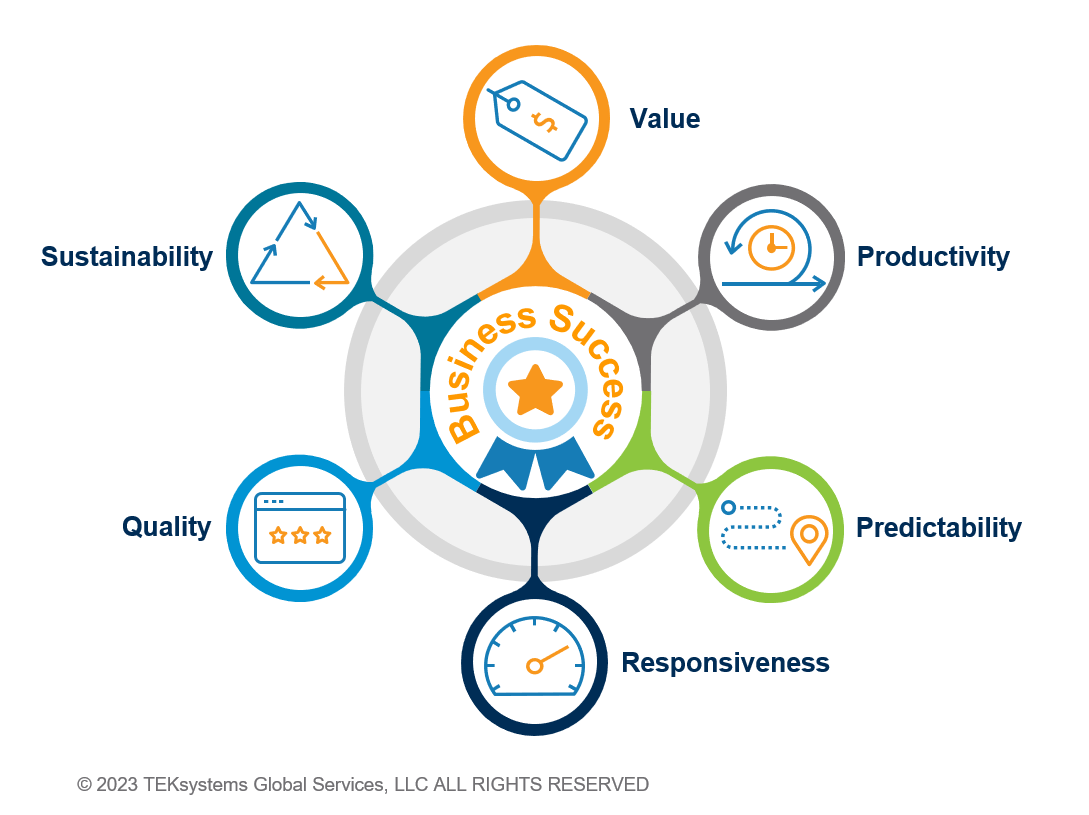
These six dimensions describe evidence to look for as part of an Agile Transformation, building on the work of Larry Macheronne and Troy Magennis.

This post follows up on a Twitter thread I posted in November exploring ways of measuring the predictability of teams. I also discussed some of these ideas in a Drunk Agile episode. When I begin working with an organisation on the agile transformation, an early conversation is around successful outcomes. My work on Strategy Deployment is all about answering the …
Dave Snowden recently posted a series of blog posts on A Sense of Direction, about the use of goals and targets with Cynefin. As the X-Matrix uses measures in two of its sections (Aspirations and Evidence) I found that useful in clarifying my thinking on how I generally approach those areas. Lets start by addressing Dave’s two primary concerns; the …