
I have written before about the messy coherence of X-Matrix correlations and how the corner matrices represent correlation rather than causation. It is a point worth restating, because it is easy to forget once we start filling in the cells.
Spurious Correlations
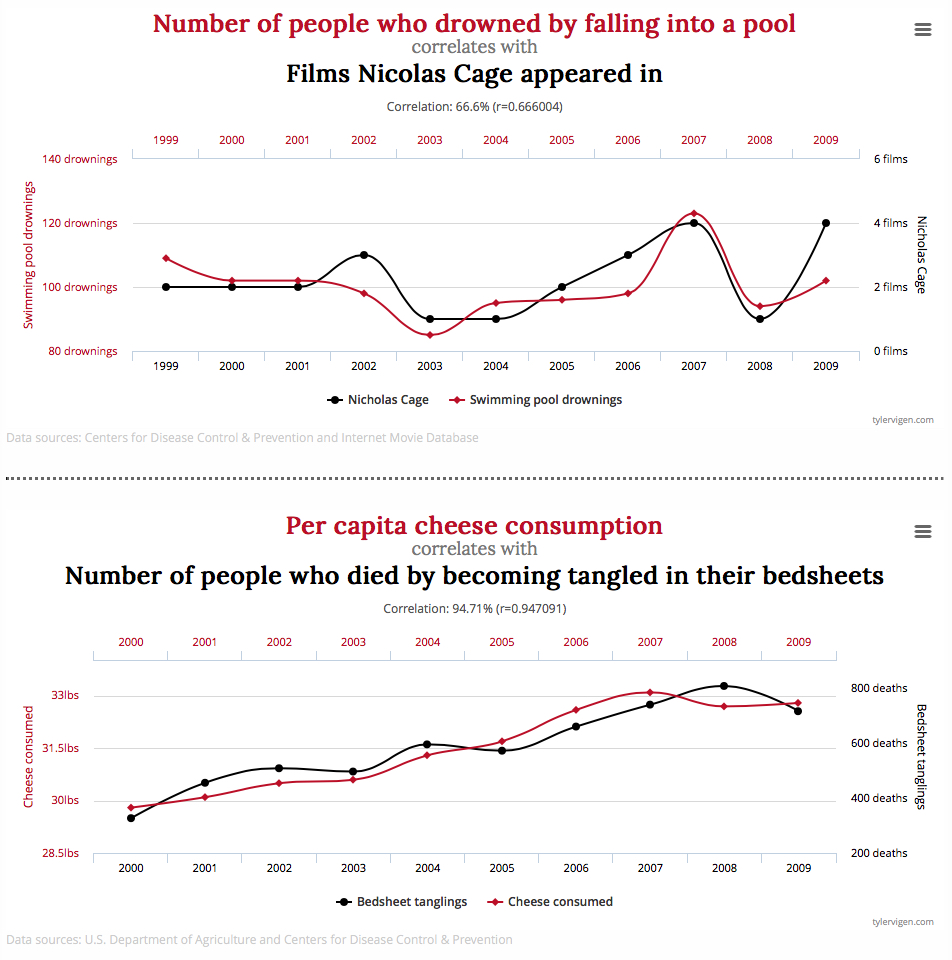
Some of the most memorable lessons in statistics come from plainly absurd correlations. Tyler Vigen’s Spurious Correlations project has built a small comedic empire from them. Between 1999 and 2009, the number of Nicolas Cage films released each year tracks the number of people who drowned by falling into a swimming pool with uncanny accuracy. From the same article, per capita cheese consumption rises and falls with deaths by entanglement in bedsheets. As far as I know, no one has yet suggested that Leaving Las Vegas causes drownings, or that cheddar provokes a fatal struggle with one’s duvet. The correlations are real. The causations are not.
These examples are funny precisely because the connection is so obviously non-existent. But there is a more useful version of the same lesson, and that version is the one that matters when we look at an X-Matrix.
Associated, Not Causal
The classic example here is the correlation between ice cream sales and shark attacks. Both rise at the same time of year. Buying an ice cream does not cause anyone to be bitten by a shark. But the two are not unrelated either. They are bound up with each other, like the entwined threads in the above picture, indirectly connected by warmer weather, more swimming, and more people in the sea. The connection is real, even though it is not direct.
The useful consequence of that association is that one variable can serve as a signal of the other. If ice cream sales were rising sharply, you would have some reason to expect a busier season for the coastguard, even though selling fewer cones would do nothing to prevent the shark bites. The ice cream is not a cause. It is an early indicator that something connected to it is also changing.
This is the version that matters when we look at X-Matrix correlations.
Correlations On The X-Matrix
Applying this to X-Matrix correlations, take the lower, right corner where Evidence meets Aspirations. In a Lean Agile transformation, we might have an Aspiration to reduce time-to-market by 50%, and identify Evidence such as average lead time, the percentage of work completed within WIP limits, or the number of teams practising continuous delivery. Reading the X-Matrix clockwise, it is tempting to assume the Evidence will cause the Aspiration to be met. Drive down the lead time, and the time-to-market follows.
But the relationship is correlational, not causal. Reducing lead time does not cause faster time-to-market. Like ice-cream sales and shark bites, the two are bound up with each other. They are connected through the same underlying system: the way work is structured, how dependencies are managed, the technical practices in use, and the organisation’s willingness to release more often. Because of that association, a falling lead time becomes a useful early signal that time-to-market is likely to follow.
This is why Evidence and Aspirations are often described as leading and lagging indicators. The Evidence is what you can see early; the Aspiration is what you can see later. They move together because they are bound up with each other, not because one drives the other. Just like ice cream and the sharks.
Why This Distinction Matters
Treating the X-Matrix correlations as causations risks two failure modes.
The first is gaming, the leading measure. If you believe lead time directly causes time-to-market, then driving down lead time becomes the goal in itself. Teams find ways to shorten lead time without changing the underlying system. They might split tickets smaller, redefine what counts as done, or start the clock later. The leading measure improves. The lagging measure does not. The association has broken down, and the signal becomes meaningless.
The second is mistaking a coincidence for an association. Not every measure that moves alongside the Aspiration is genuinely bound up with it. Some leading indicators look like ice cream sales but are closer to Nicolas Cage films. In other words, they share a trend with the Aspiration without any real underlying connection. Treating them as signals of progress is reading meaning into noise.
Looking For Coherence, Not Cause
What X-Matrix correlations are really doing, then, is not laying out a chain of causes but exploring a web of associations. We are saying we believe these things hang together. And we are saying if we see this Evidence, we will have reason to think we are making progress towards that Aspiration. What we are not saying is that one makes the other happen.
This is why messy coherence matters more than a tidy causal story. A clean cause-and-effect explanation is reassuring, but in a complex organisation, it tends to be wrong. A coherent set of associations is more honest. It treats the visible measures as signals of deeper structural and behavioural shifts, and keeps inviting us to look for them.
Nicolas Cage and the swimming pools are funny because the connection is plainly nothing. The ice cream and the sharks are useful because, although neither causes the other, the two are genuinely bound up with each other. Enough that one can serve as a signal of the other. The X-Matrix correlations sit closer to the second example. The correlations are real, the associations are real, and the system we are trying to change is what holds them all together.